Project Overview
The current state of healthcare in the United States demonstrates a critical need for a solution that is accessible, educational and effective for disparate populations. Minorities, low-income and rural populations are the most difficult groups to target, yet dominate the overall cost of healthcare spend and exhibit the most need for meaningful interventions.
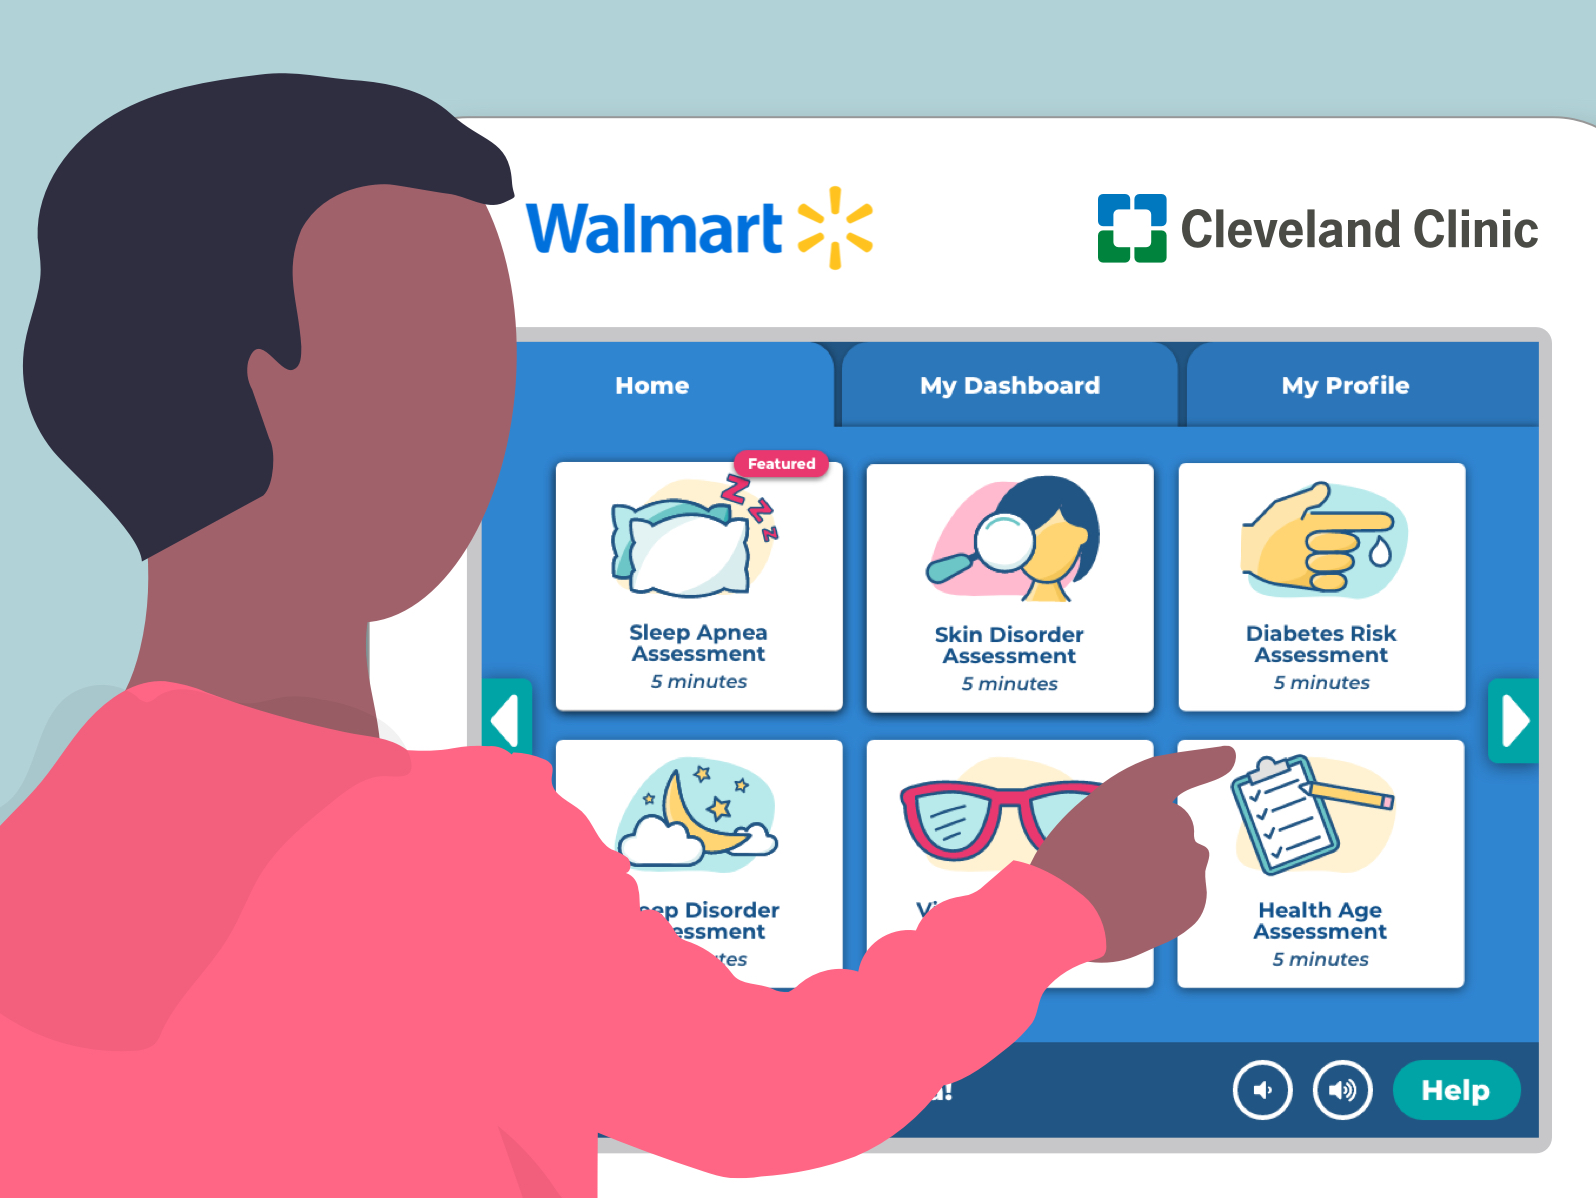
The Pursuant Health kiosk provides a valuable health resource that is highly accessible and free to the public. While the kiosk is used by every demographic and can benefit the health of any individual, the nature of the platform displays exceptional promise for underprivileged populations who lack the monetary resources and geographic location to access regular healthcare. With locations in over 3,600 retail locations throughout the United States, a kiosk can be found within 10 miles of 79% of the US population.
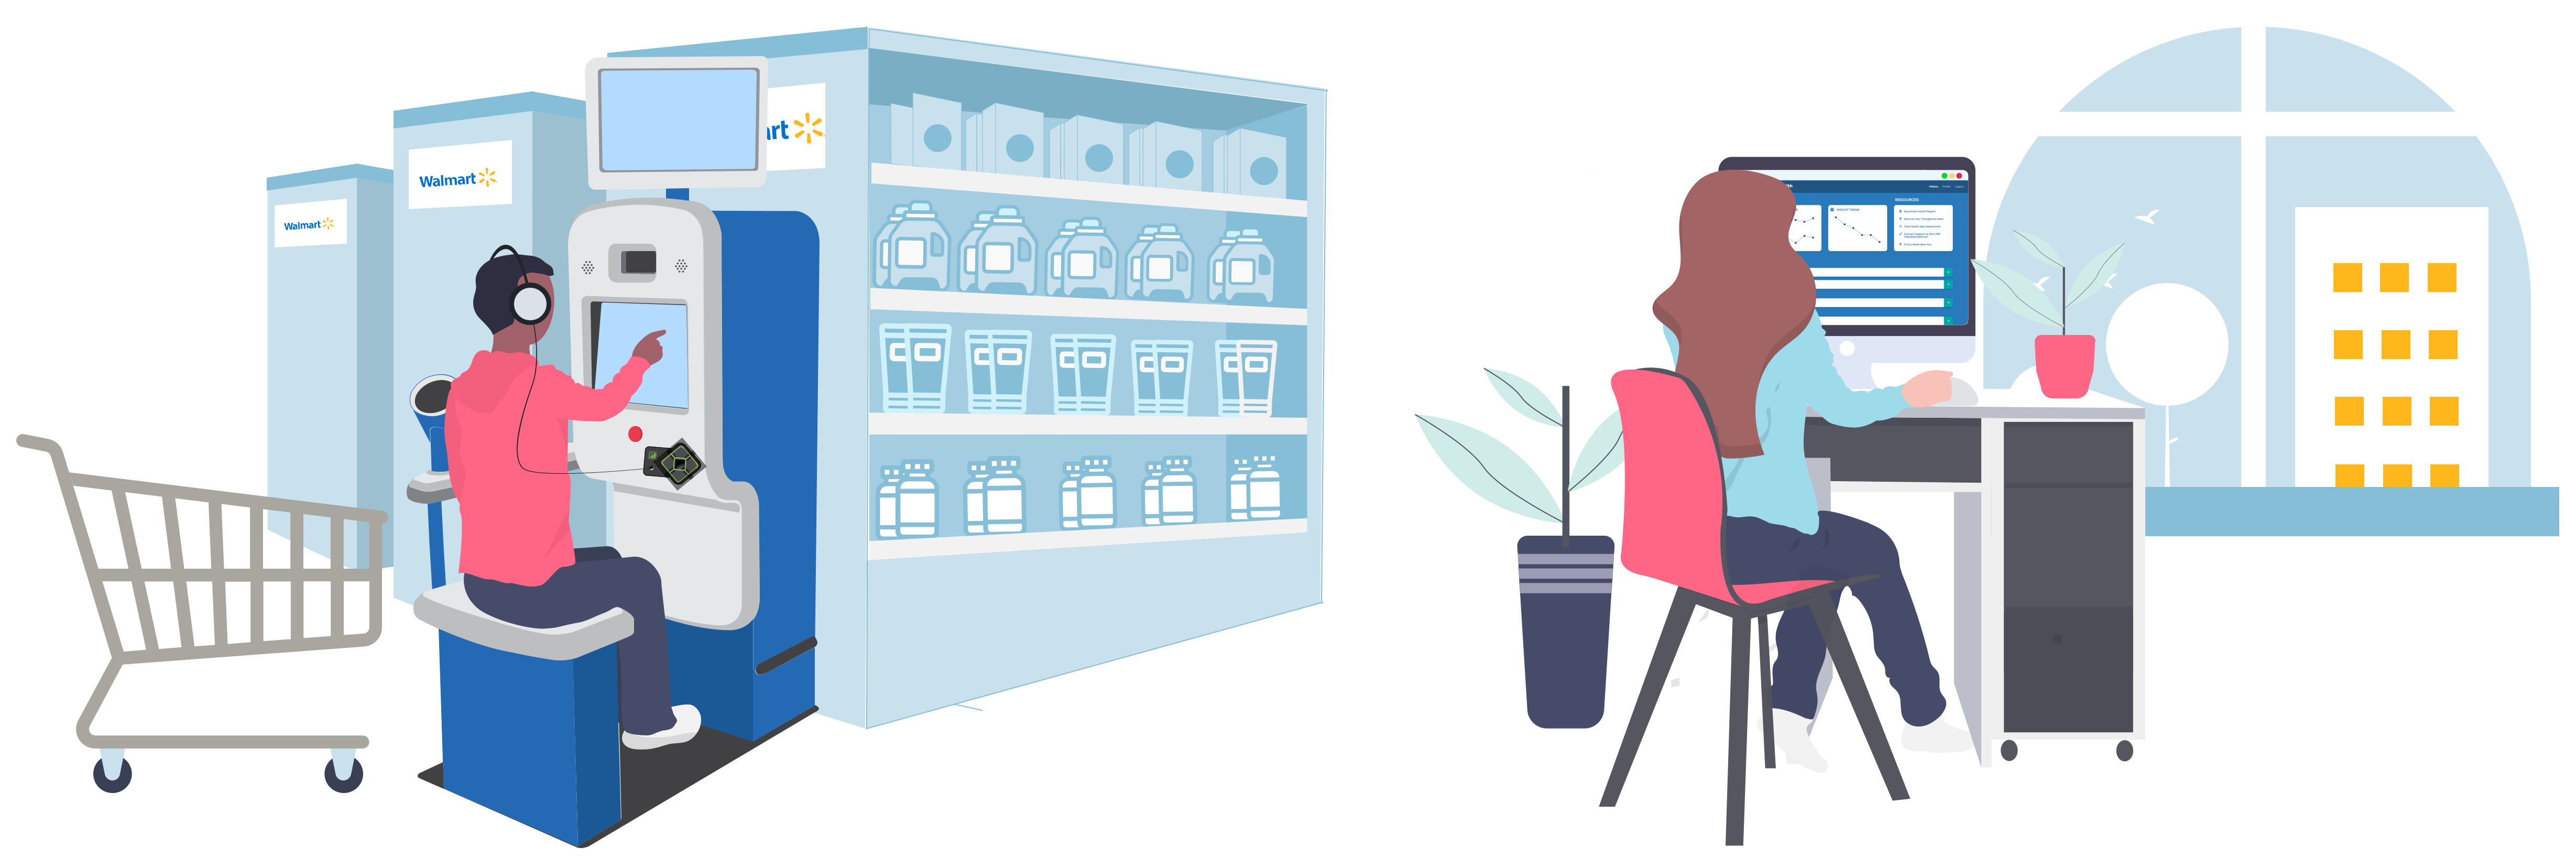
Through a partnership with Cleveland Clinic Wellness, kiosk users can access a variety of evidence-based coaching programs that target critical health issues like tobacco cessation and weight loss. The success rates for Cleveland Clinic Wellness programs indicate exceptional potential for driving positive behavior change and improved outcomes for at-risk individuals in need of comprehensive programs and education. Cleveland Clinic’s E-coaching, or email-based coaching, consists of personalized guidance from a real coach that is performed through email exchange. This method of coaching is used on the basis that it is convenient for the participant and allows for frequent communication.
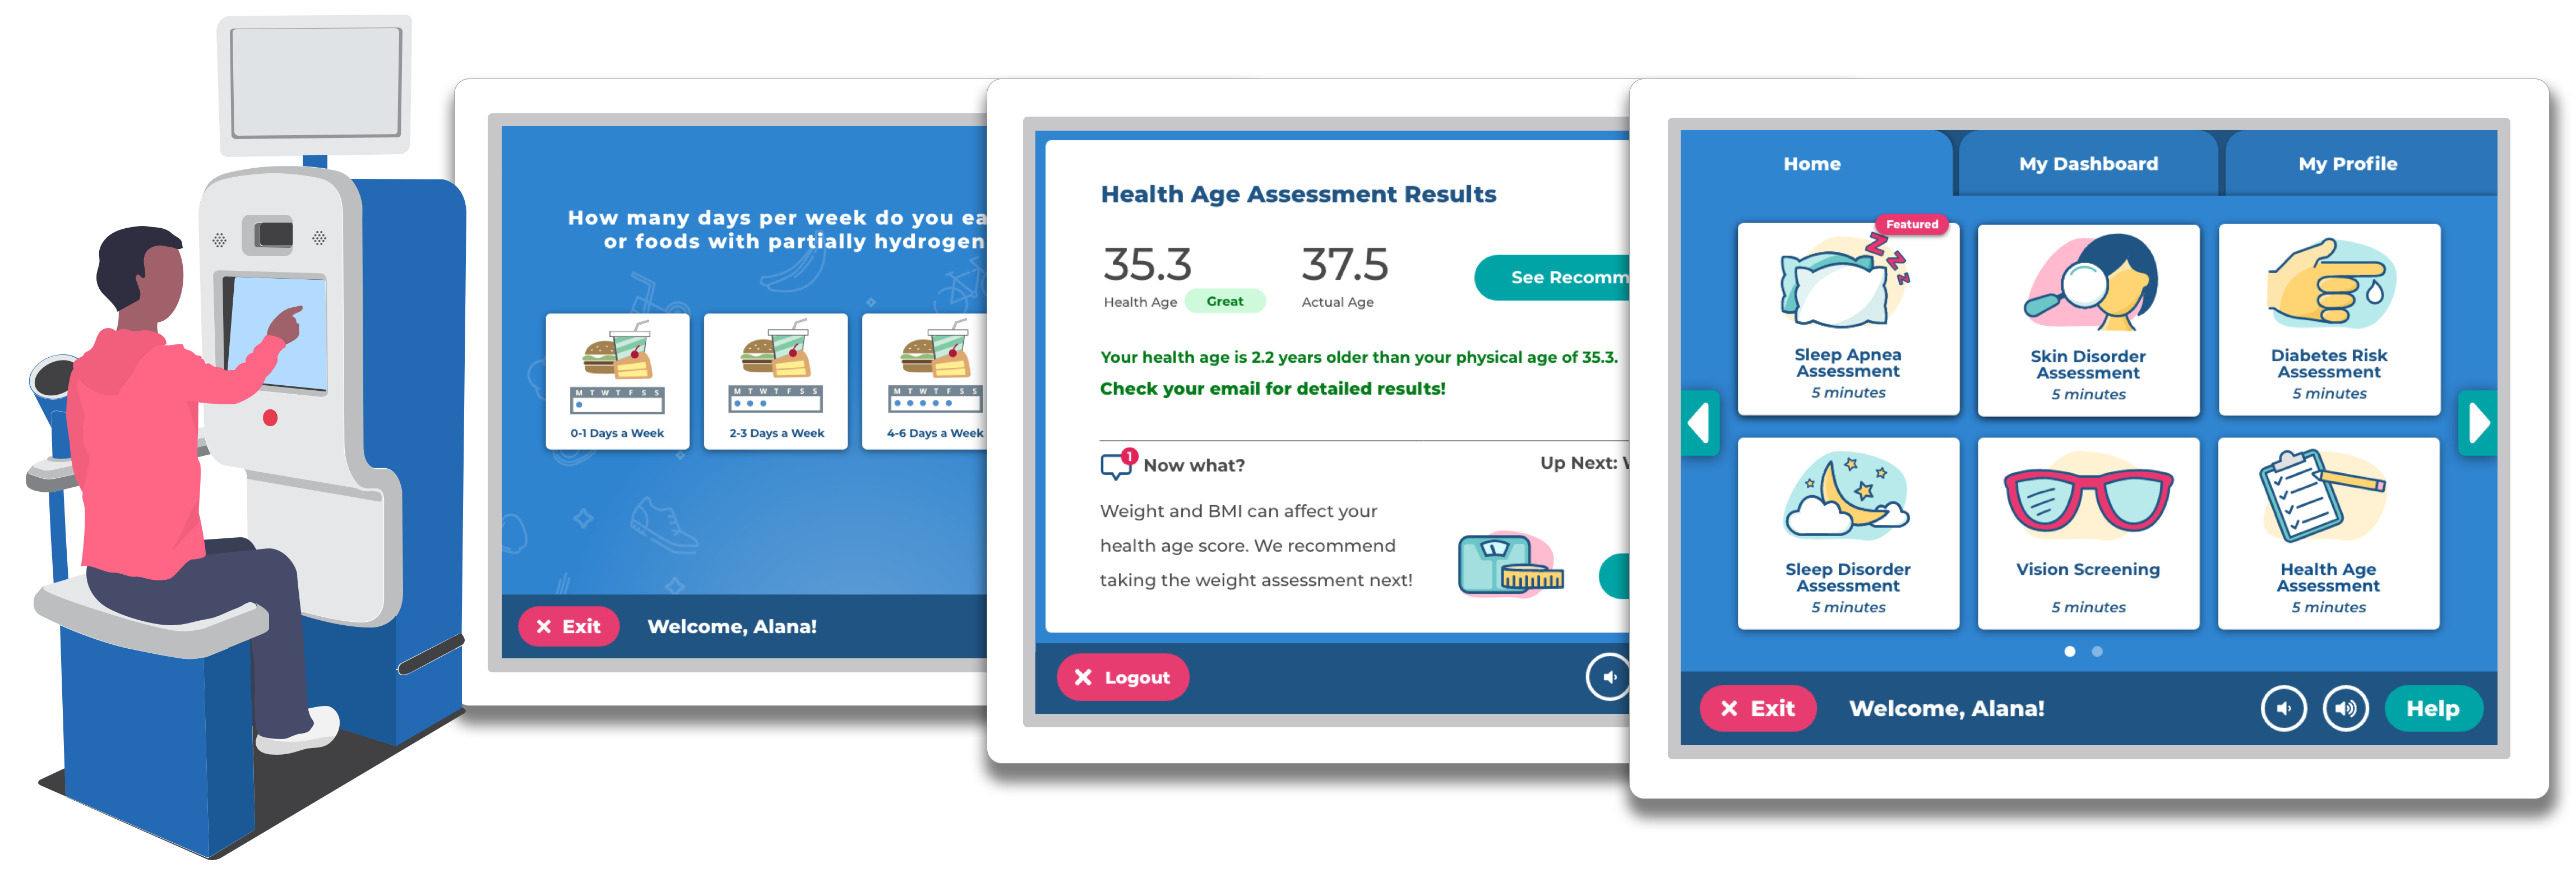
The Health Age assessment aims to develop a user-friendly assessment tool in collaboration with Cleveland Clinic Wellness experts. The tool measures weight, blood pressure, and lifestyle and behavioral factors to calculate a user's Health Age compared to their actual age, with an average completion time of 4-5 minutes on both kiosk and web platforms. Users are provided with personalized recommendations for improving their Health Age, while also identifying potential health risks based on their inputs and non-invasive biometric measurements.
Health Age Assessment Design and Development
Collaborating with Dr. Michael Roizen and the Cleveland Clinic Wellness team, we designed and developed the NCQA-certified Health Age assessment. We followed established HRA (Health Risk Assessment) standards from major health insurers as a guide, incorporating innovative elements based on a proprietary algorithm for calculating Health Age.
During the comprehensive testing phase, which ran parallel to development, we prioritized usability testing and user feedback at every stage. This user-centric approach, informed by industry standards, allowed us to refine the assessment iteratively and include customization options for additional questions, ensuring a flexible and user-friendly interface.
The testing phase also enabled us to implement targeted interventions throughout the assessment, guiding users to plan-specific wellness programs based on their unique health profiles. By aligning with industry standards and leveraging a proprietary algorithm, we optimized navigation, reduced completion time to 5-7 minutes, and ensured accessibility with a 5th-grade reading level and concise question count (25-34 questions).
Ultimately, our collaborative effort resulted in the NCQA certification of the Health Age assessment in Wellness and Health Promotion (WHP) by March 2016. This certification validated the assessment's effectiveness in delivering actionable insights and empowering users to proactively manage their health.
Usability Testing
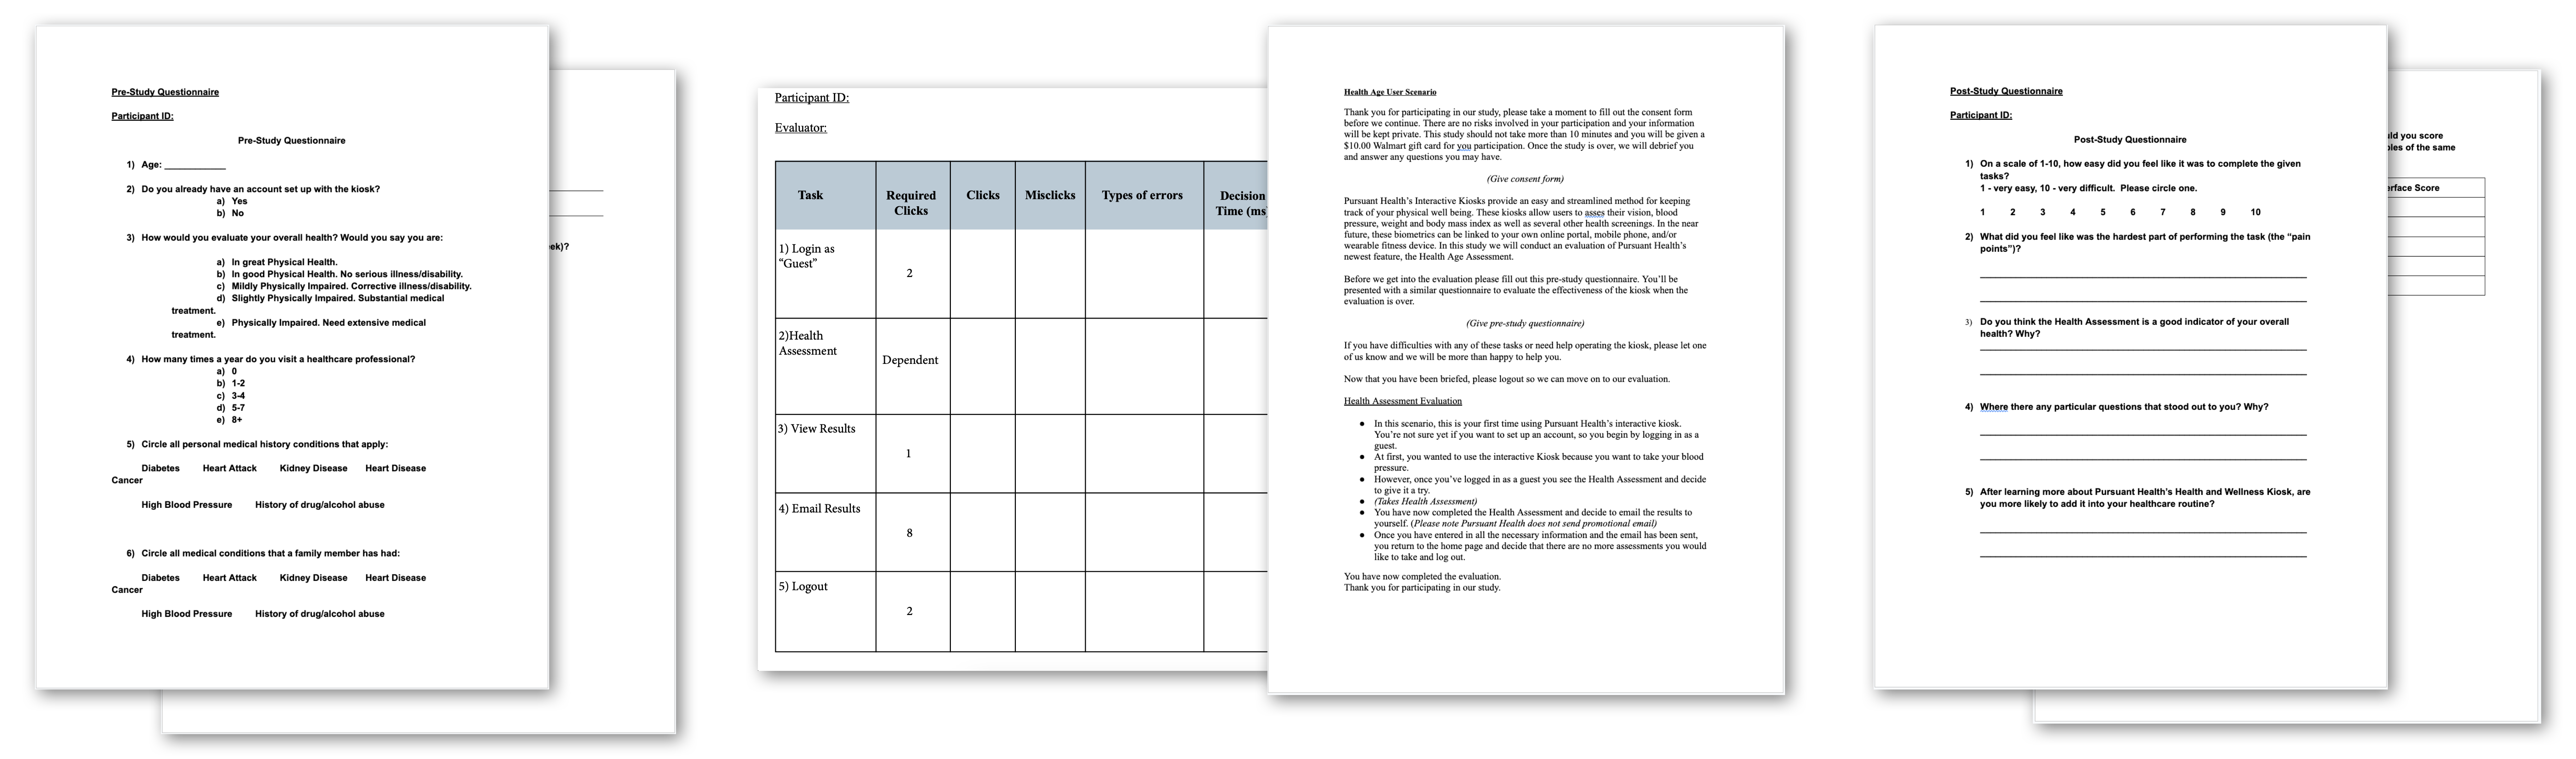
We performed usability testing during a limited release of the kiosk’s new user interface in two Walmart locations in Atlanta, Georgia. The overall objective was to identify how the system’s conceptual model aligns with users’ mental models of the system to determine potential design requirements. The evaluation was composed of three parts:
- Pre-study survey
- User scenario evaluation test
- Post-study survey
A total of ten (N=10) individuals participated in the testing. Users were divided up evenly between the two locations; five users at the Chamblee Dunwoody Walmart and five at the Ashford Dunwoody Walmart. The age of users tested ranged from 27 to 79 and the breakdown consisted of 20% ages 20-29, 20% ages 30-39, 20% ages 50-59, 20% ages 60-69 and 20% ages 70-79.
Testing was conducted by presenting two scenarios and giving users a set of tasks to perform on the kiosk. One Pursuant Health team member was responsible for prompting the user through the experience while the other was responsible for evaluating the user’s actions. Each task completed was evaluated based on the number of correct clicks/mis-clicks, types of errors associated with the mis-clicks, the time it took the user to make each decision and any calls for help.
Findings
Pre-Study Survey:
- The pre-study survey revealed that only 60% of users considered themselves to be in good health. 30% self-reported their health as average (with a corrective illness or disability) and 10% reported as slightly physically impaired. No users considered themselves to be in great physical health and none reported being fully physically impaired.
- Eight out of ten users (80%) had concerns about a personal family medical condition. The breakdown consisted of 20% concerned about heart disease, 20% about diabetes, 20% about blood pressure, 10% about cancer and 10% about renal insufficiency.
User Scenario Evaluation Test:
- The tasks that proved the most difficult for users included emailing results, logging in to an existing account and entering an email address.
- Tasks with a 100% success rate (no errors) included viewing results, taking weight (BMI) test, going to user dashboard and logging out.
Post-Study Survey:
- Users were asked to report how easy it was for them to perform the given tasks on a scale of 1-10 (1 being the easiest and 10 being the most difficult). 7 out of 10 users (70%) marked a "1" (very easy), 20% marked a "2" and 10% marked a "6".
- When asked which feature would be the most helpful for users in reaching their health care goals, 50% said the blood pressure test, 30% said the ability to track and trend individual progress and 20% said the vision assessment.
- After learning about the Pursuant Health kiosk, eight out of ten users (80%) plan to include it in their regular health care routine.
- 60% of users said their main purpose in visiting the kiosk is to keep up with their health while the remaining 40% use the kiosk out of concern for their blood pressure and/or weight (BMI).
Usability Testing Conclusions and Recommendations
This testing exhibited that although the majority of participants found the tasks to be “very easy”, the usability can be improved to ensure maximum efficiency and simplicity for all kiosk users. We created a list of recommendations following the usability testing for modifying the interface software. Recommendations include increasing the visibility for certain buttons, making the “Dashboard” and “Profile” features more obvious to the user, creating a more comprehensive data storage system that seamlessly transitions data for users who visit the kiosk before creating an account as well as improving other minor interface functionalities.
- Enhanced Contextual Information for Cleveland Clinic Association:
Provide clear and concise information about the Cleveland Clinic and its association with the Health Age assessment. This will help users understand the significance of the assessment and how it contributes to their overall health journey. - Improved User Guidance for Checkbox Selection:
Clarify that selecting "none of these" or leaving checkboxes unchecked is equivalent to not choosing any options. This will reduce user confusion and ensure a smoother experience when navigating the submission process. - Expanded Comparative Results Display:
Include a comparative range of Health Age results alongside individual results. This comparative view will allow users to gauge their status more effectively and understand how they compare to others in terms of health age. - Enhanced Health Age Results Visualization:
Implement an interactive bar graph that visually compares Health Age to Physical Age. Utilize color changes to indicate when Health Age surpasses Physical Age, making it easier for users to interpret and engage with their results. - Inclusion of Progress Bar for Assessment Navigation:
Incorporate a progress bar during the Health Assessment to provide users with a clear indication of their progress and remaining assessment duration. This addition will enhance user experience by reducing uncertainty and improving engagement. - Clear Communication of Health Age Assessment Purpose:
Clearly communicate the purpose of the Health Age assessment and its connection to Cleveland Clinic wellness programs. Highlight the benefits of the assessment in improving overall health to increase user engagement and motivation.
Field Soak Benchmarking
The Health Age Assessment was deployed to Pursuant Health kiosks located in Florida and Georgia. Pursuant Health collected data from April 2015 to July 2015 in order to compare metrics between kiosks with the new user interface (N=317) and kiosks without the new interface (N=3178).
Findings
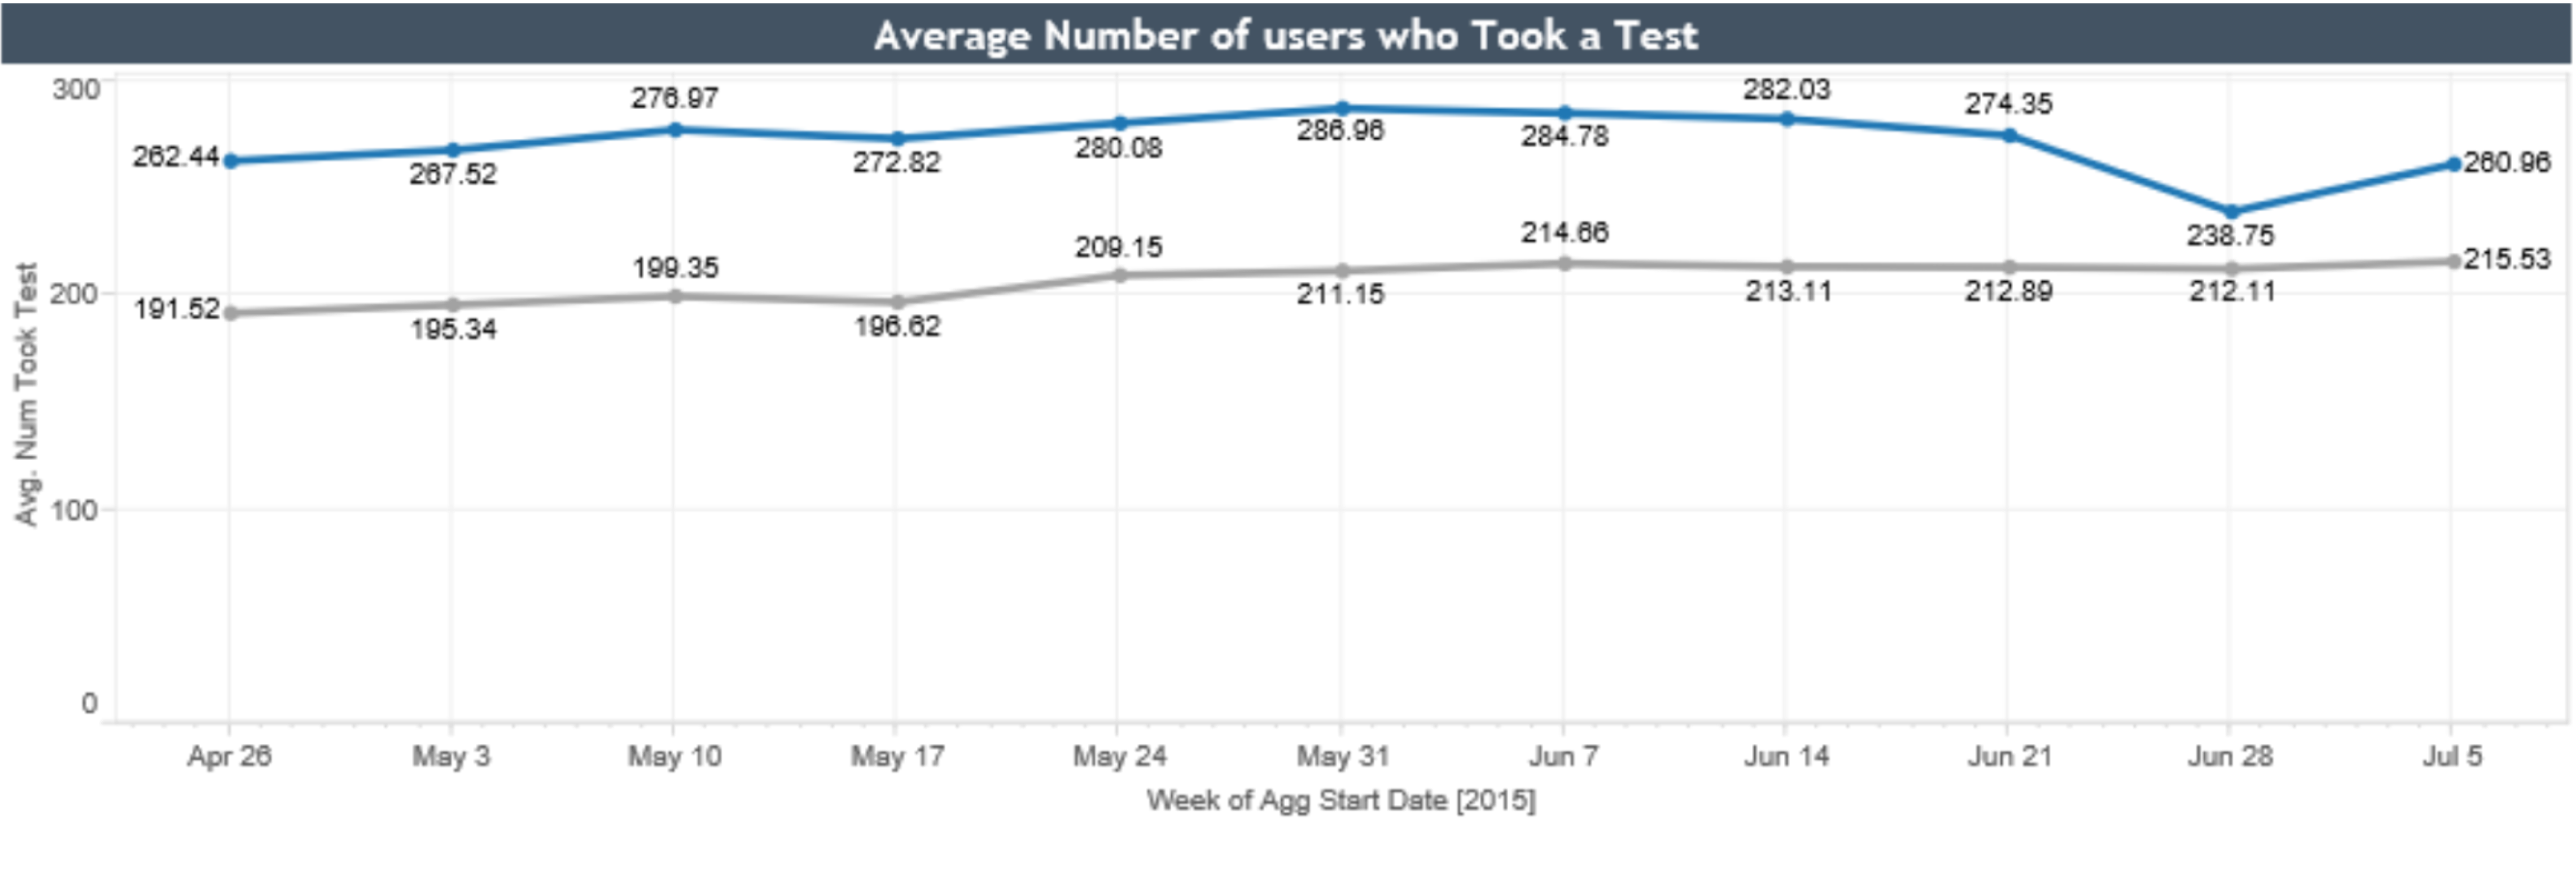
1. As illustrated on the graph below, more users took tests (including blood pressure, BMI, vision, etc.) on the new user interface. The overarching goal of the kiosk is to entice users to complete health assessments so that they may obtain a robust, well-rounded understanding of their health status. The increase in tests taken on the new interface suggests that enhanced software has the power to engage more individuals in learning about their health.
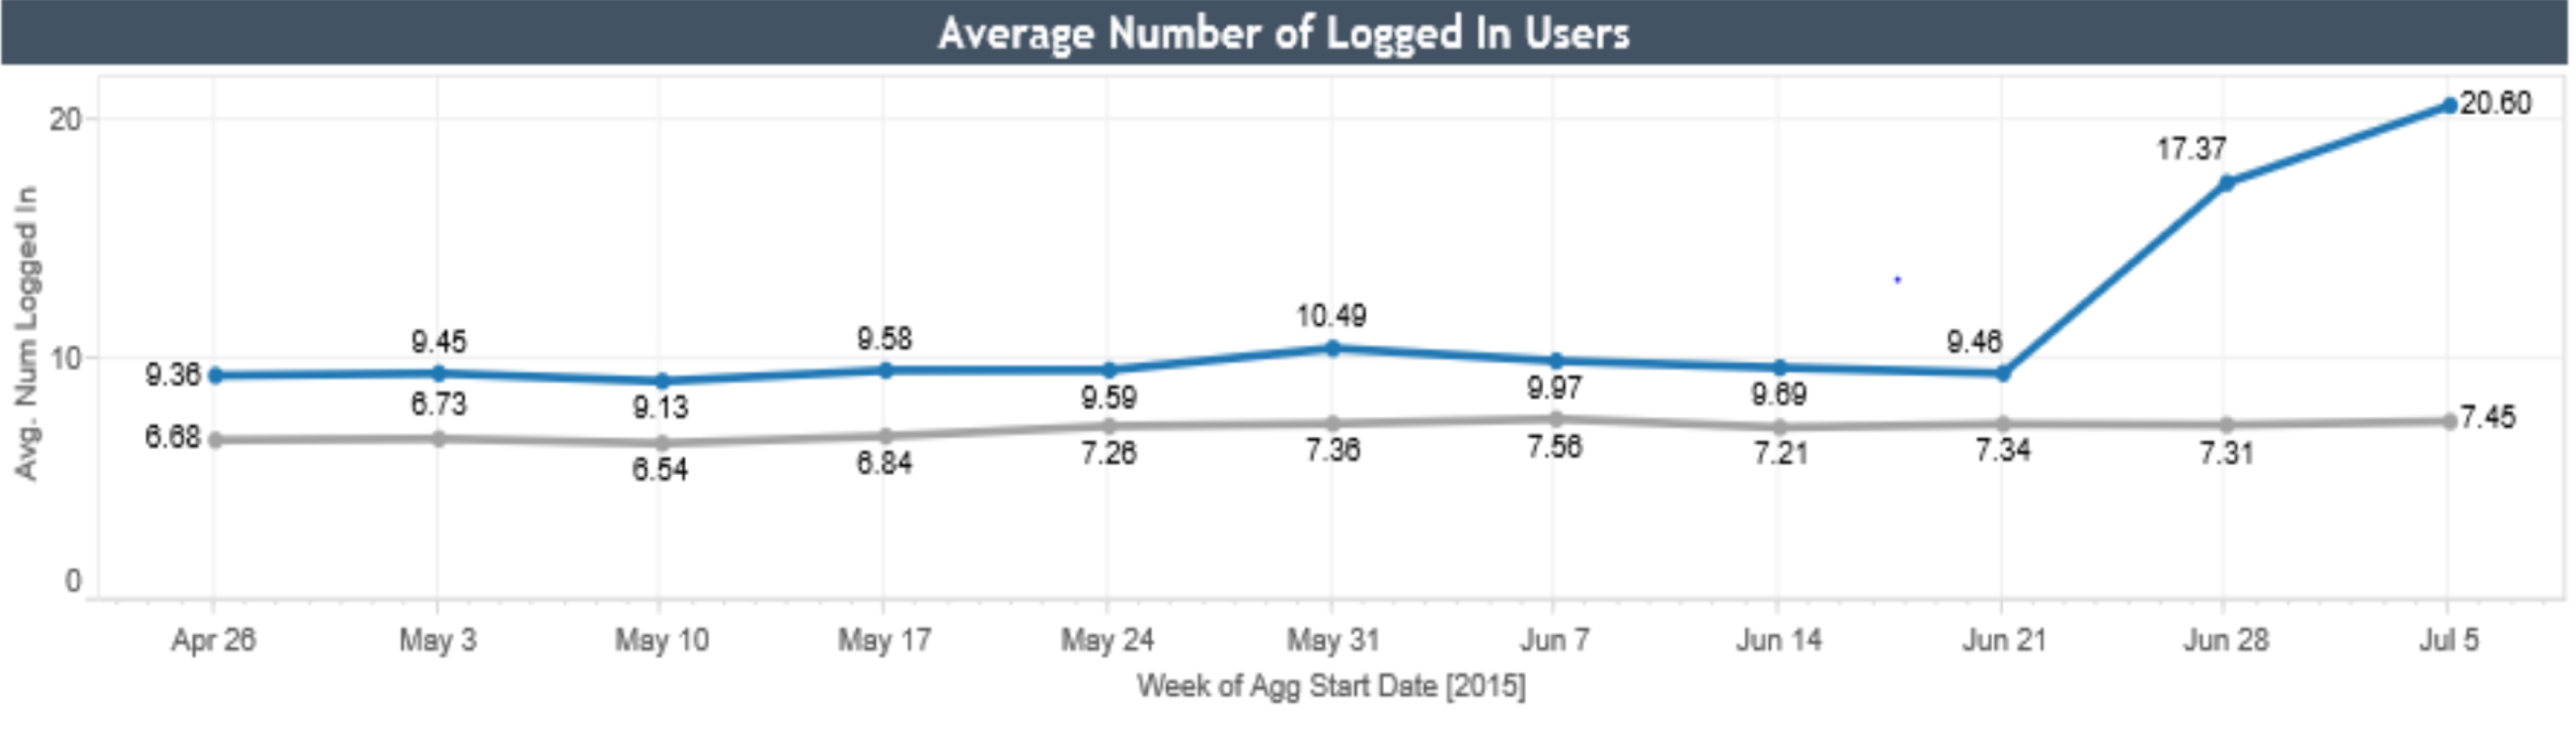
2. The increase in logged-in users is a critical finding. Because users can only save results and track data by logging in with their account, it is imperative for individuals to log in so that they may view trends in their blood pressure and BMI.
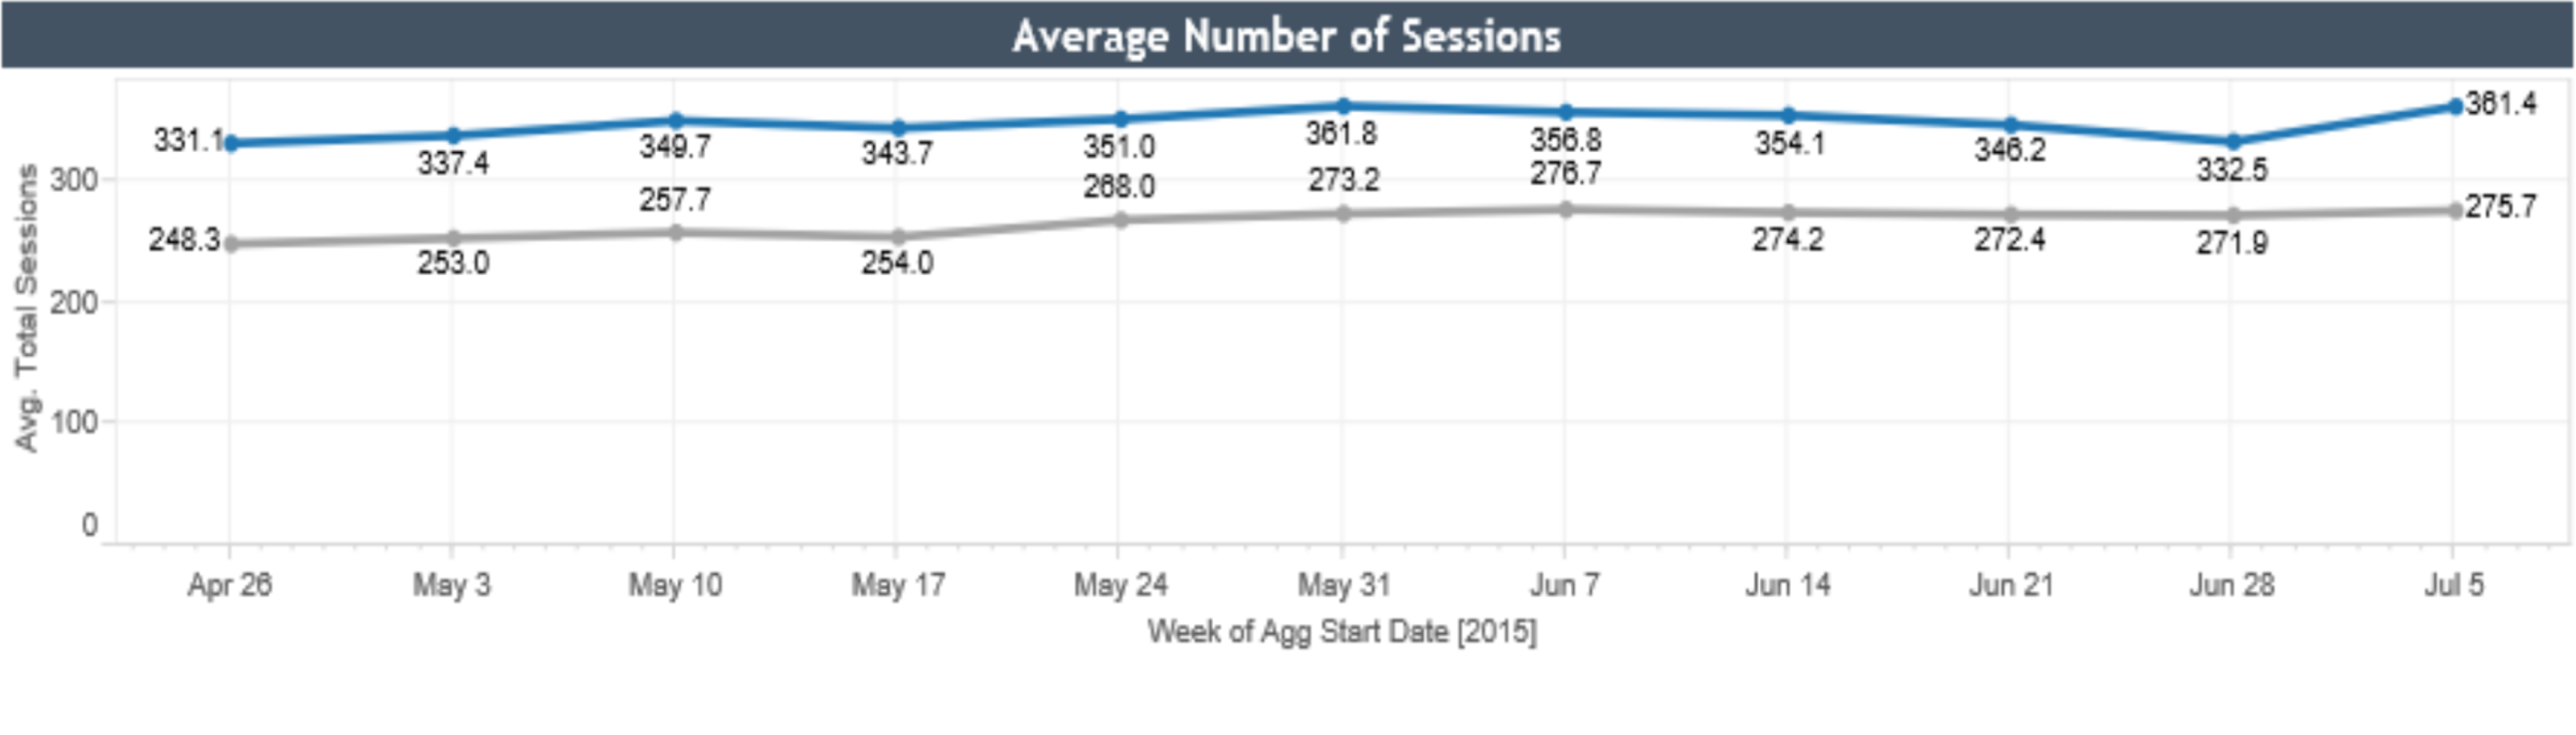
3. The average number of sessions is consistently higher in kiosks containing the new user interface. This steady increase suggests that the new welcome screen displayed on the kiosk is more inviting to users and provokes more interest.
Positive Health Outcomes
Tobacco Cessation Program:
- A group of participants (N=81) enrolled in the Cleveland Clinic Tobacco Cessation e-coaching program. At the end of the program, 32 participants had dropped out of the program, resulting in 49 remaining active participants.
- 41 participants from this group successfully quit smoking with the guidance of the program. This accounts for 51% of the total group including dropouts (N=81) and 84% of the active participants (N=49).
Weight Loss e-Coaching
- Average weight loss of 21.1 pounds
- Average BMI reduction of 2 points
- Average waist circumference reduction of 3.5 inches
Stress Management Program
- 30% reduction in perceived stress
Improved Sleep Program
- 56% completion rate
- 41% decrease in PIRS score
- 10% increase in sleep efficiency
Nutrition Program
- Average weight loss of 2 pounds
- Average waist circumference reduction of 0.5 inch